
Visualization Tools
Build Visualizations, User Interfaces, and server configuration interfaces for .NET, web technologies, native iOS and Android mobile apps. Developers can choose from components and libraries for creating visualization apps. Or use the built-in Web HMI Dashboard for immediate visualization of data in any desktop or mobile client.
Product Overview
The EAS Platform includes a variety of Visualization Tools to allow you to create user interfaces and HMIs for Windows PCs, native apps for mobile devices, and web applications that can be run in any browser in any environment. Visualize live and historical data, live and historical Trends and Alarms on virtually any platform including mobile devices and web browsers.
EAS provides SDKs and tools for web, desktop, and mobile application development using data from any EAS server. Additionally, the EAS REST API can be used on any platform for programmatic data access and server configuration. Learn more about the benefits of an open platform for visualization.
Platform Components

The core of the EAS Platform, enabling data connectivity, server-to-server networking, and more

Read and write data to Allen Bradley, Siemens, and Modbus devices, Universal Drivers, OPC, OPC UA, databases, Excel, and read MTConnect.

Log events to open databases, and send notifications via SMS, email, and voicemail
Log data in open format to MS SQL Server, Oracle, mySQL, PostgreSQL, InfluxDB, MongoDB, SQLite, MariaDB, Access, SQL Azure, Amazon Aurora, Amazon RDS, Amazon Redshift, Google Firebase, and CSV files

Connect to cloud-base IoT gateways such as AWS, Azure IoT, and MQTT
Develop custom automation apps for Windows, web, and mobile devices. Integrate with .NET and REST APIs. Build custom integrated device drivers.

Provides the most robust, scalable, and reliable distributed networking platform for IIoT solutions
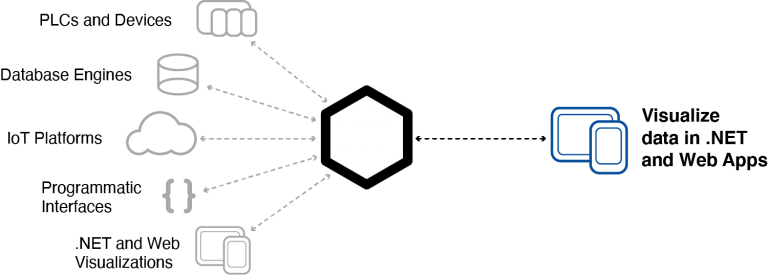
Visualization Data Sources
EAS supports a large library of Industry 4.0 data sources including Allen Bradley and Siemens PLCs, Modbus and MTConnect devices, OPC UA and DA Servers and Clients, Databases, applications, and more. Once connected, data accessed and visualized with using any EAS Visualization Tools.
.NET Visualization Tools
.NET Developers have access to visual controls for developing HMIs or User Interfaces in WinForms and WPF. Using the .NET Core Components of the .NET Data Connector, developers can create native iOS and Android apps using Xamarin Forms.
WinForm HMI .NET
Develop Windows Forms applications in .NET using either C# or VB.NET. Includes a wide variety of visual controls.
WPF HMI .NET
Develop visually stunning WPF applications in .NET using C# or VB.NET along with XAML. Includes a wide variety of visual controls.
Trend .NET
Create real time and historical Trend visualizations, plotting multiple simultaneous data points. Interactive visual controls for analyzing and exporting data.
Alarm .NET
View and manage real time and historical Alarms. Interactive control allows users to acknowledge and comment on alarms, or filter based on any attribute.
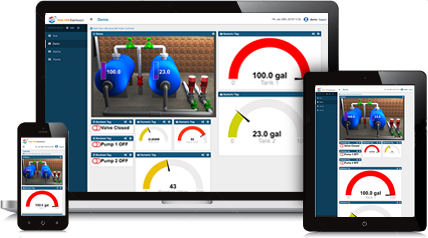
Web Visualization Tools
Built upon the open standards of HTML5, CSS, and Javascript, EAS Web products can be utilized in any web application environment, and can be developed using your favorite IDE or code editors. Running applications can be viewed in any desktop or mobile browser.
Web HMI
Develop web applications or integrate with existing web apps to display, modify, and control real time data in an EAS Service, all from within a desktop or mobile browser.
Web Trend
Create real time and historical Trend visualizations, plotting multiple simultaneous data points displayed in any desktop or mobile browser.
Web Alarm
View and manage real time and historical Alarms. Interactive control allows users to acknowledge and comment on alarms, or filter based on any attribute.
Web HMI Dashboard
A pre-built web application allowing users to quickly visualize data without writing any code. Includes modules for tag, alarm, and trend visualization.